Recently I hosted a Zabbix Certified Specialist course and got some questions on the Menu entry URL option which exists for triggers at hosts (and ofcourse also templates).
What is a Menu entry URL
You can use a Menu entry URL to give your users an option to visit a specific URL (for example a Wiki on a specific topic regarding common problem which was detected by your trigger). But you can also use it more smarter and give your users a short cut to more information on the host.
Host dashboards
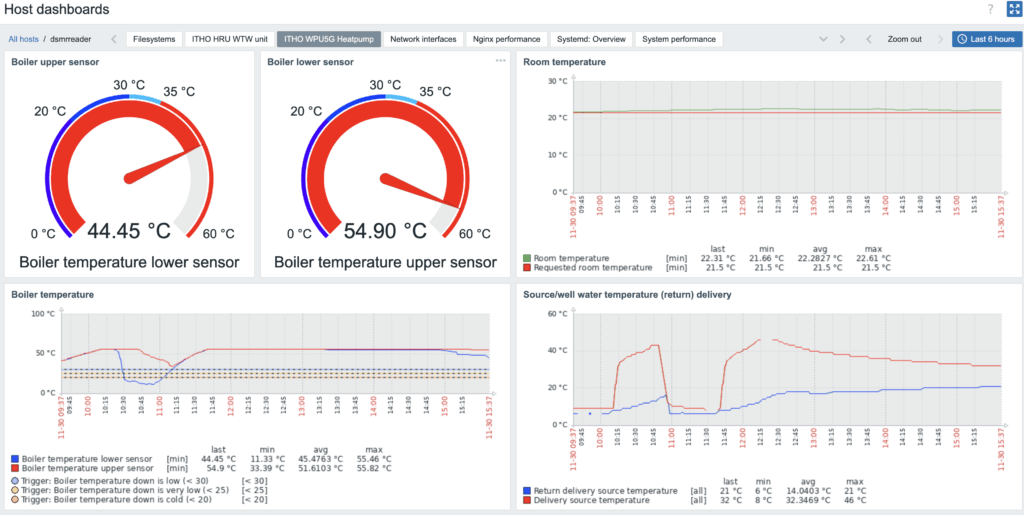
A great thing to see is that more and more templates are expanded with Host dashboards (which you can find in Monitoring -> Hosts -> Dashboards of a specific host). Like you can see in the screenshot below:

With host dashboards it’s very easy to create a dashboard specific for a host and a topic on this host. For example the performance of the Apache webserver, Linux performance or the usage of a ITHO WPU5G Heatpump:
Menu entry URL
When a trigger evaluates the metrics and will mark the data as a problem, it will show up with its defined severity level on the problems page (Monitoring -> problems) or one of your own defined Global dashboards.
You define a trigger on a host or template level, and at that page you can find the Menu entry URL. You can see this in the screenshot below:
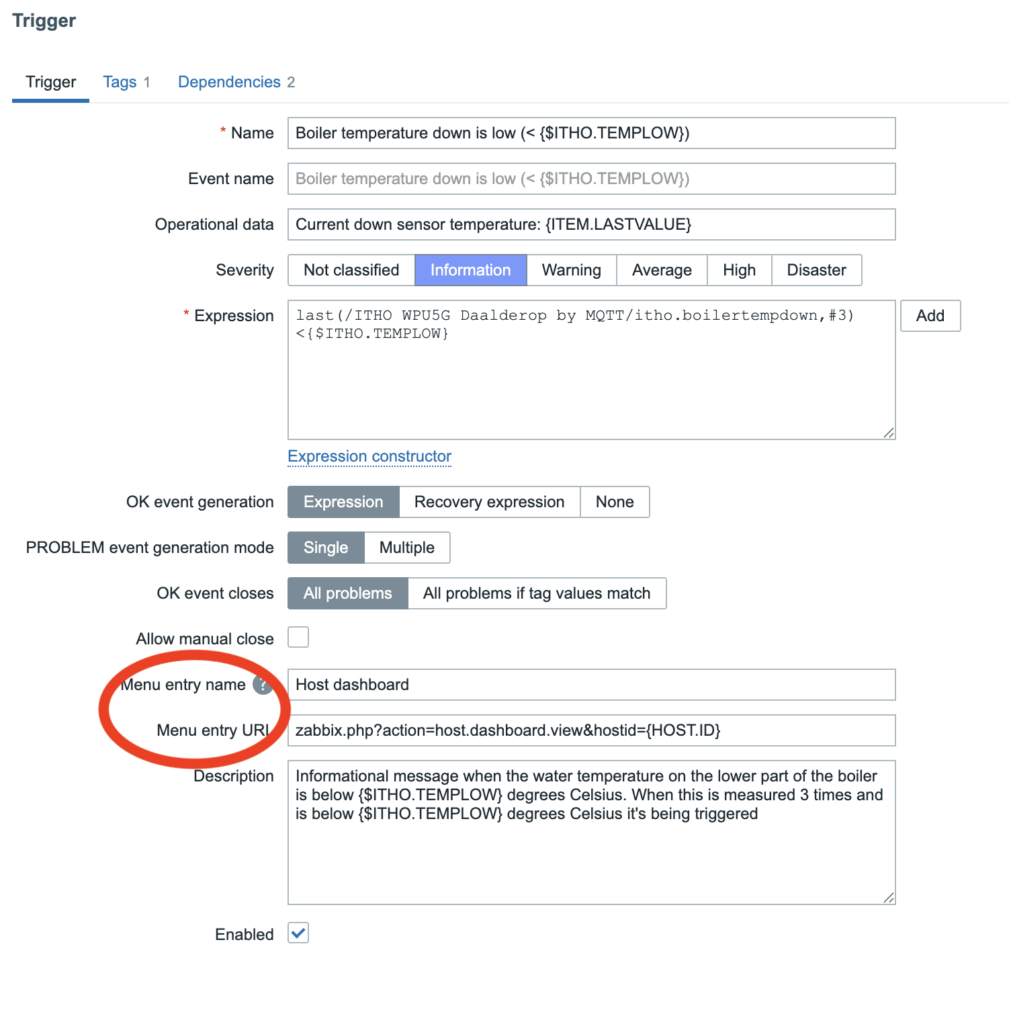
As you can see, you can add a short name (which will be shown when you click on the link of a problem) and the URL.
By using the following URL (which is relative to your Frontend URL which you can define in Administration -> General -> Other), you always have a shortcut to the related dashboard on the host with a problem:
zabbix.php?action=host.dashboard.view&hostid={HOST.ID}Menu entry in action
When a trigger fires, you can click on the problem and get a small pop-up menu with different options. Especially with network interface you get a list of graphs and I somehow always manage to click the wrong one (the part which doesn’t show the graph where I can see the problem). For these problems, a Menu entry URL directing me to the Network performance dashboard of a host would be better.
In the following screenshot you’ll see the Menu entry name (which I defined for the Menu entry URL) when I click on a problem to get more info on the problem:
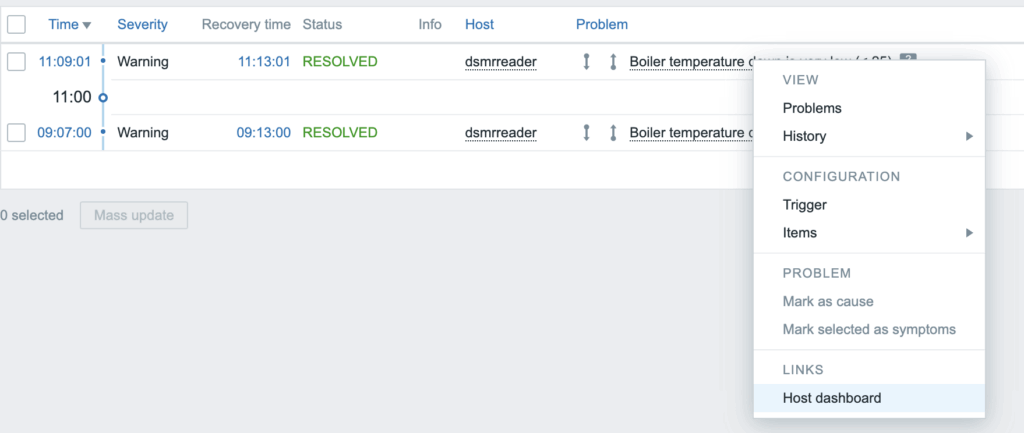
This shortcut redirects to the Host dashboard of this host, so I can start analyzing what would be the cause of a problem.
Make things better
With this blog post I hope to have helped you on a even more ease of use Zabbix on your platform!