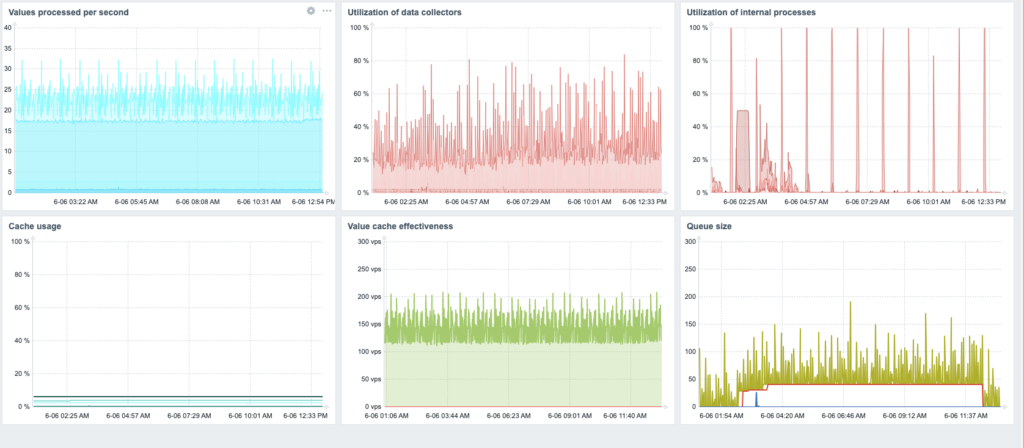
As I’ve upgraded Zabbix to 7.0 LTS, I found some dashboards not displaying information anymore. This was also the case with the Zabbix health dashboard (an important dashboard to regularly check for bottlenecks in your Zabbix server).
Zabbix health templates
First things first! Before even changing the health dashboard, you have to make sure you’re using the latest compatible (7.0) Zabbix server template. This guarantees that you also measure the metrics needed to check your Zabbix server.
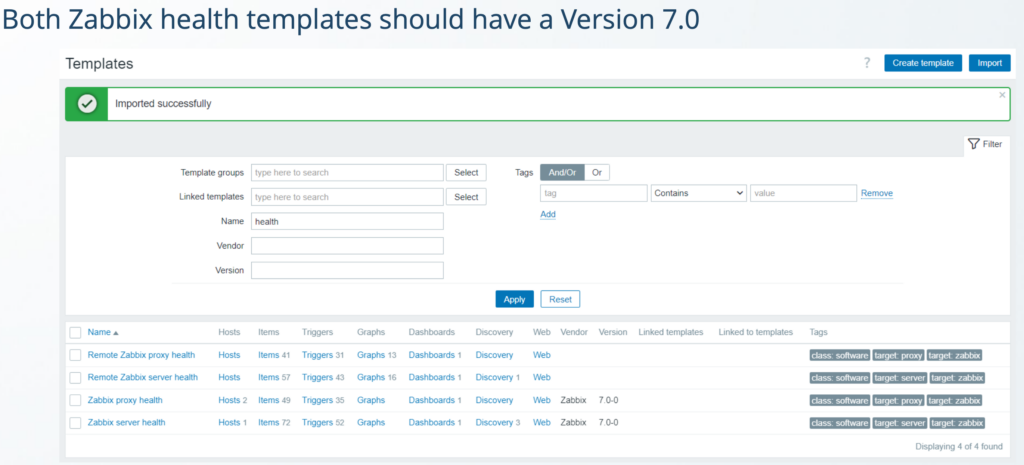
You have to download both the Zabbix server and Zabbix proxy health templates and import them in your upgraded Zabbix server. The new templates can be found at the Zabbix git repository. Here you have to choose the right source (so that will be Release 7.0) and download the yaml files for both Zabbix proxy and Zabbix server. After you downloaded these, you can import them in the “Data collection -> Templates” menu.
After importing the new Zabbix server and proxy health templates, it should look something like this:
Change Zabbix health dashboard
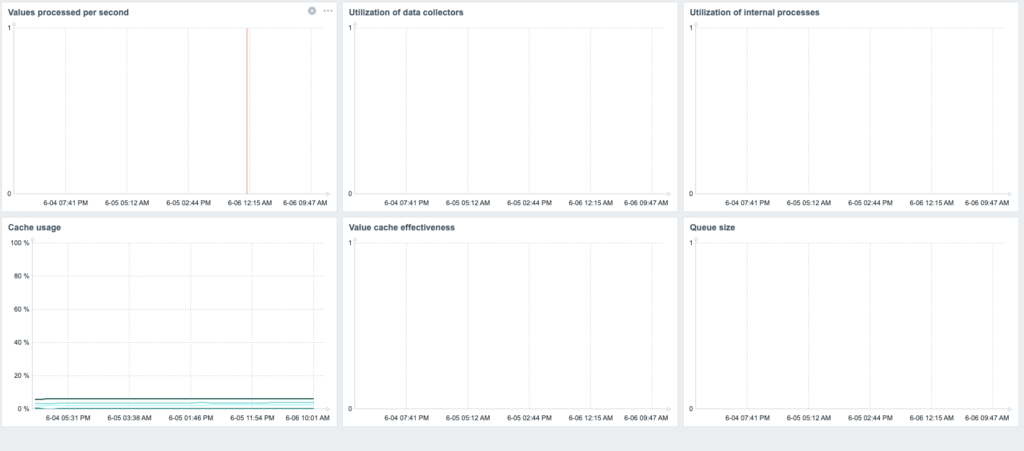
For this dashboard to display the much needed information correct I had to change a few of the widgets so they select the right items. Per widget I have included the state I found it in and the state (with selected items) afterwards.
This turned out to be a good exercise for me, as I recently renamed my Zabbix server and found out that some widgets still pointed to the old server name :-).
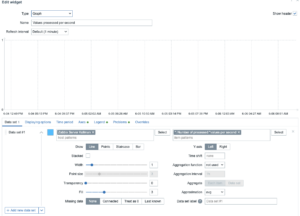
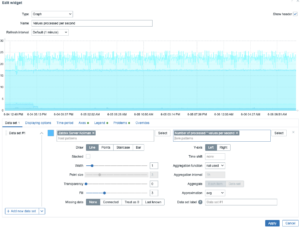
Values processed per second
At first I changed the values processed per second widget. For this I had to change the selected items to Number of processed* values per second. This selects all items starting with Number or processed and ends with values per second for the selected host in this widget.
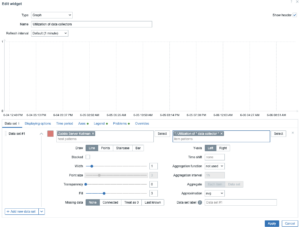
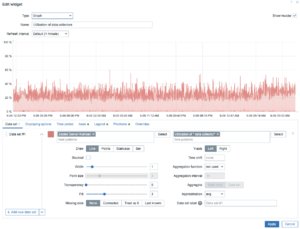
Utilization of data collectors
The next widget I changed is the Utilization of data collectors. For this I had to change the selected items to Utilization of * data collector*. This selects all items starting with Utilization of and also has data collector in its name.
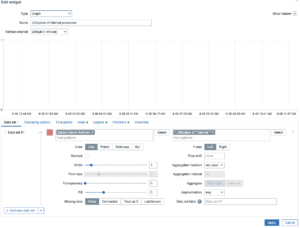
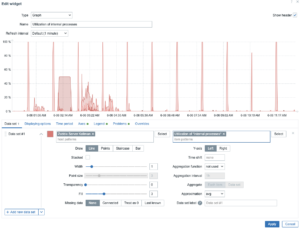
Utilization of internal processes
Another widget which had to change was the Utilization of internal processes widget. I had to change the selected items in this widget to Utilization of *internal processes*. This selects all items for the hosts which start with Utilization of and also has internal processes in its name.
Value cache effectiveness
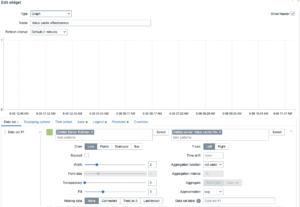
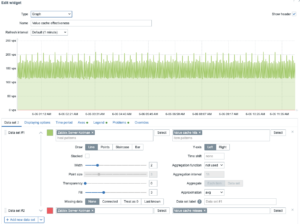
While changing the Value cache effectiveness widget, I found out that I’d forgotten to change this one a few weeks earlier after renaming my Zabbix server. So this exercise proved to help me getting a better insight for my Zabbix server :-).
To change this widget I had to change the selected items to Value cache hits and for the second dataset to Value cache misses.
Queue size
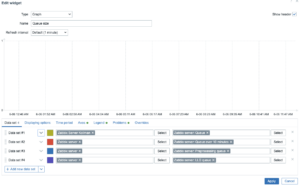
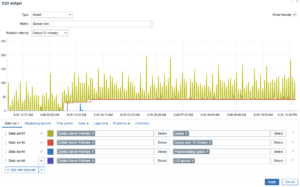
Last but not least, the widget Queue size had to be changed to represent the right information on my Zabbix Server health to me. Also in this widget I saw I hadn’t changed everything to the right server a few weeks ago, so also a great update for my dashboard! :-).
The selected items aren’t pinned to a specific server anymore, just an item for a server. I changed the datasets 1 till 4 and selected Queue, Queue over 10 minutes, Preprocessing queue and LLD queue.
Don’t forget to also add two new queues to this graphs, that should be Connector queue and Discovery queue.
The result
After applying all the changes to the widgets (and ofcourse saving the dashboard! :-)) I got my overview on the health of my Zabbix server back. After the changes it looked like this:
